Why create a SEO dashboard?
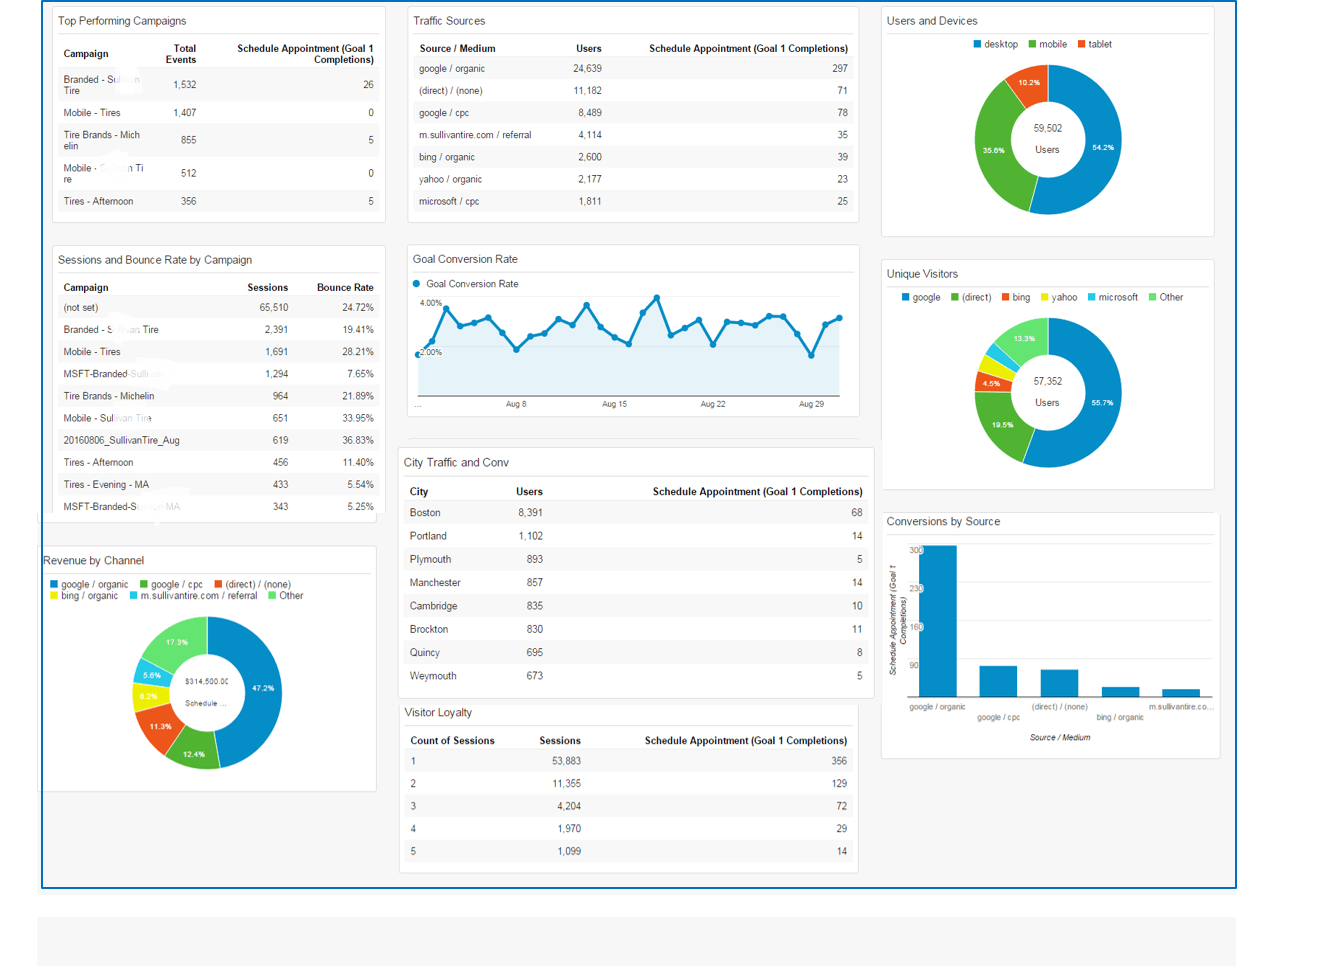
Although Google Analytic’s lets you see a host of organic search metrics, they are segmented into buckets by Audience, Acquisition, Behavoir, etc.. creating an isolated view of one metric per page view, whereas SEO dashboards bring several metrics into one page for easy review and analysis.
Google analytics seo dashboard
What makes a great Organic Search Dashboard?
The ability to view key performance metrics quickly and the flexibility to tailor views to your specifications.
- Monitoring your overall organic search reach
- What are the top landing pages from organic search (with goal completions and /or conversions)
- What e-commerce comes from Desktop vs. Mobile
Your Organic Search Dashboards might include metrics like…
| Top Organic Landing Pages | Traffic Sources |
| Source of Organic Visits | Top Viewed Pages |
| Total Organic Visits | Top Exit Pages |
| Acquisition/Behavior/Outcome (ABO) | Top Search Engine Sources |
| Branded vs Non Branded Keywords | E-commerce |
| 404 pages | Mobile vs Desktop |
| Referring sites | Site performance |
| Link Analysis | Content marketing performance |
With the “Add Widget” function, there are six types of standard widgets to choose from and four real-time:
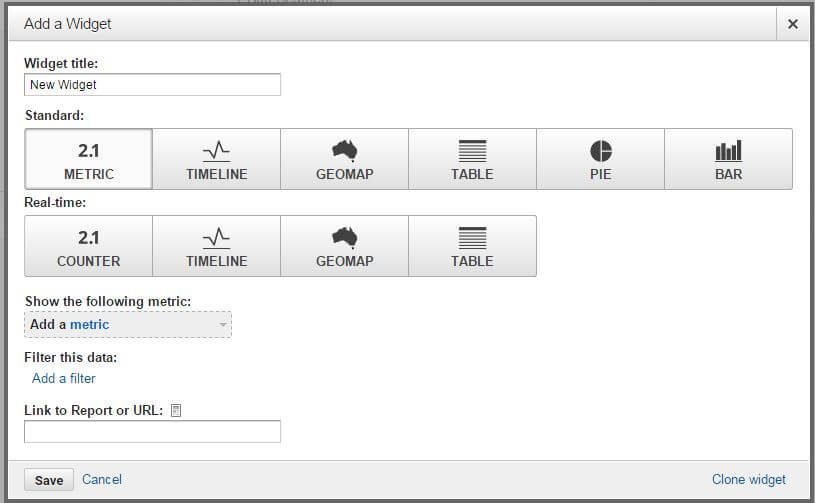
Metric – This shows you a single metric as well as a “sparkline” for that metric (a tiny line graph)
Timeline – A graph (only) of any metric (or compare two metrics) over any period of time
Geomap – Displays on several levels including content to city level
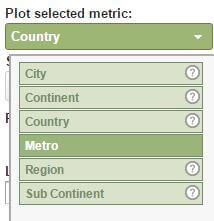
Table – Regular Google Analytics table, can be customized to show your preferences (including filters)
Pie – Displays a breakdown of various metrics (up to 6 slices) in pie chart form (can also do doughnut shape charts too)
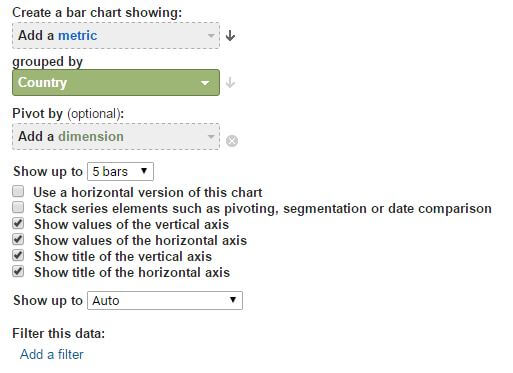
Bar – Displays a breakdown of various metrics (up to 9 bars) across two dimensions and 4 grid lines
When it comes to e-commerce and dashboarding you can create widgets in the dashboard to highlight
| Revenue | Top Products |
| Revenue by Product Category | Conversion Rate |
| Revenue by Product SKU | Recent Transactions |
| Revenue by Source | Quantity |
| Revenue by Medium |
Analyze
- Revenue vs. Transactions
- Transactions vs. Sessions
- Revenue vs. Sessions
SEO Dashboard
What do you need to build your own dashboard that informs and provides actionable insights.
SEO analytics dashboard
Advantages of using a dashboard:
- Helps you save time and resources – display all your important information at a single glance.
- Helps you make business decisions based on real time information
- Helps you focus and track key performance data for your business
DOWNLOAD YOUR FREE GOOGLE ANALYTICS SEO DASHBOARD NOW
Exporting and Emailing Reports
Now that you have a great dashboard how do you share the report?
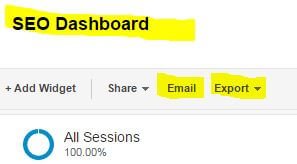
Google Analytics dashboards are easily exported as a PDF or set up to schedule an email on a periodic basis. Dashboards can be automatically sent to any email address(es) on a one-time, daily, weekly, monthly, or quarterly basis.
The great thing about these Google Analytics dashboards are they can be totally customized for any type of business
Dashboards can show you information on organic search performance for your website. Data may includes total organic visits, a graph of organic visits and statistics for landing pages showing their visits, bounce rates and conversions. This data visualization helps you see an overview of performance. Understand and gain insight into your organic search traffic faster and better today with these quick tips and free organic search dashboard download.