Yesterday Facebook announced their improved analytics tools which will allow Facebook administrators to have better visibility into how their pages are performing. Facebook has incorporated the basic components of the pre-existing insight data but they have added more components, data and functionality for a better, more detailed analysis. Some highlights of the new features are:
– The new insight dashboard will not only work for Facebook pages but also for Facebook applications and websites (using social plugins and the Facebook API).
– You will be able to view analytics around individual stories or posts on your page. The dashboard will show you how the content produced on your page performs, how your fans interact with it and the content’s reach.
– Administrators will be able to understand which tab within their Facebook page has the most traffic and which sites are the top referring sites to their Facebook page.
– There is a greater demographic analysis of the Fans of your page. Allowing you to see the data through new visualization tools and additional metrics.
– The dashboard now displays fan interaction and growth on a more granular level in addition to the old metrics. The additional data will also show you day over day change in key metrics, allowing users to have a better understanding of key activities their users are taking on the given page.
– Overall the Facebook insights are more dynamic, visually appealing and interactive through the inclusion of more granular data and additional metrics.
These new features were introduced at the f8 conference and are part of Facebooks’s plans for building a stronger analytics tool to help provide administrators with better metrics. For now, administrators need to go to go Facebook.com/Insights to see the new dashboard, as the old insights still reside on the actual Facebook tabs. We are hoping that as Facebook continues to explore these new functionalities, add additional analytical features, and pull more information through the Open Graph that we will be able to export these charts and data to help develop a more complex analysis in social media measurement. Read on for a more detailed description of the new features on the Facebook Insight Dashboard:
Dashboard Homepage:
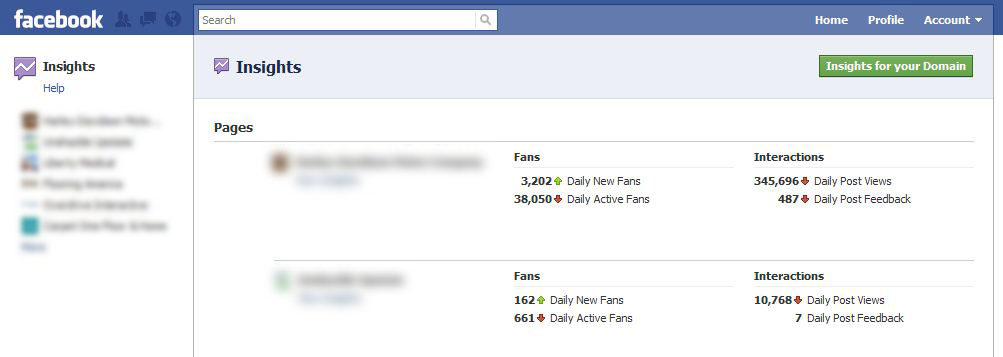
The homepage for the dashboard displays the list of pages, applications and webpages that you are an administrator of and shows you a snapshot of key metrics. It first shows the daily fan activity, indicating how many daily new fans your page received and how many daily active fans your page has. It also shows your page’s interactions, how many daily post views and the daily post feedback. (Please note: the revised dashboard still refers to “Likes” as “Fans”.)
Facebook Page Insights
Page administrators can now receive more information regarding the fan activity on their Facebook page as well as data about the content they are publishing. These insights reside within two subsections on the Insights Dashboard: Fan Insights and Interaction Insights.
Facebook Page Fan Insights Subsection
The data reveals daily active users, new fans, and total fans of your Page. The first chart displays the Daily Active Users (also referred to as DAU and defined as users who have engaged with your Page, viewed your Page, or consumed content generated by your Page). The chart is joined by a table illustrating the key types of user interaction and their change (positive or negative) since the previous day. The second chart demonstrates the number of new fans and removed fans. This chart is accompanied by a table indicating the top sources by which people became a fan of your page (for example: fan page, stream, requests, etc.)
The next major section is demographics, which provides similar data from the old insights. However, this data is demonstrated through new visualization tools and breaks down the demographics of the pages fans into the following five categories: gender, age, country, city and language.
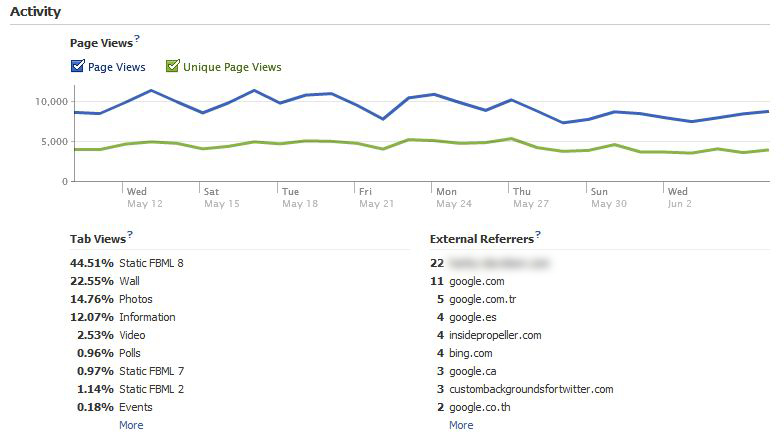
The last section is a breakdown of the activity of your Facebook page. The first chart shows the number of page views (number of hits to your Facebook page) and unique page views (unique logged-in Facebook users who have visited your page). A new feature is the traffic breakdown of your page tabs (based off the percentage of page visits) and the top traffic referrers to your page. Administrators can now see which tabs are garnering the most attention (from the pages wall tab to custom FBML tabs) as well as what is the highest traffic driver to their Facebook page. This is followed by media consumption data, where administrators can see how many video plays, photo views and audio plays are occurring on their tab page daily.
Facebook Interactions Insights Subsection
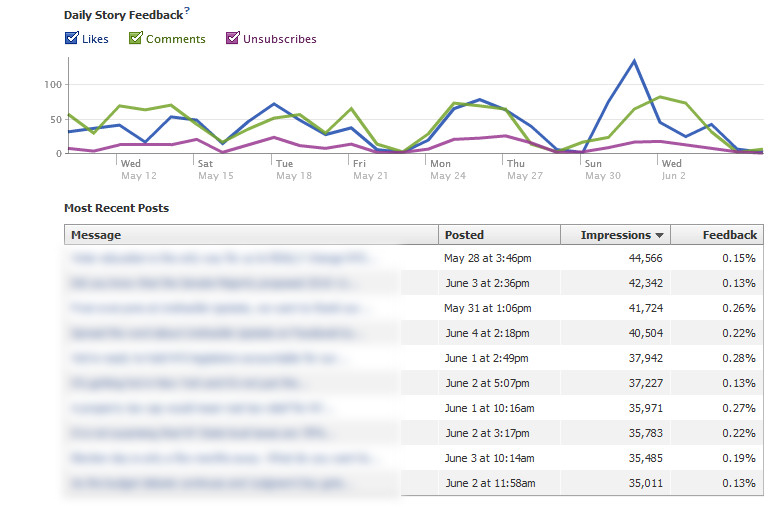
A major change to the Facebook insights can be found in the Interactions subsection. Before, where there was just information on how many likes, comments and wall posts occurred each day, administrators are now able to view data on the data your fans consumed. Depending on the type of page you are viewing insights for, you will be able to see the number of daily post views, daily post feedback, daily shares, feedback per share, reshare rate in addition to the number of likes, comments and unsubscribes. This level of granular data is a great addition for administrators trying to understand the rate of consumption of their content as well as what type of content is resonating best with their fans. In addition the chart, the top 10 posts are listed and then can be sorted by each of the individual columns, allowing administrators to view the date from several different perspectives.
The last part of this subsection is Page Activity where administrators can see how their fans have chosen to engage with the brand beyond liking and commenting on posts. This chart details mentions, discussion posts, reviews, wall posts and video posts.
Overall, Facebook has made many changes to the insights data and has plans to continue to develop the dashboard further. We will have to stay tuned to find out if some features such as setting date ranges for data and exporting graphs are incorporated. However, in the meantime, this is a great addition to the arsenal of analytics that Facebook is now providing administrators and social media marketers.
Search marketing is fundamental to increasing a brand’s online presence, whether paid ads or keyword-saturated action pages, allowing companies to achieve the coveted front page of search engines. However, the search marketing sphere constantly evolves and algorithms update, leaving marketers…
Since the announcement of The Privacy Sandbox in 2019, the digital marketing world has been preparing for the “cookie apocalypse” and how to move forward without Google’s third-party data. For those who may not be aware, The Privacy Sandbox is…