Learn. Share. Succeed.
-
Infographic
SEO Ops Map
The SEO Operations Map lists all tasks, technologies, and skills needed to launch and maintain a successful enterprise SEO program.
-
Webinar
Unpacking the Power of Retail Media Networks
Retail media networks are reshaping the digital marketing world. Watch the recorded webinar to delve into this fast-growing domain swiftly.
-
Webinar
Improving Lead Quality Through Conversion-Based Personas
Overdrive’s recorded webinar explores how understanding the post-conversion mindset of your customers can help to improve lead quality.
-
Video
ECommerce Dashboard Demo
With mQuantify, marketers can drill down into detailed performance metrics, allowing for omnichannel insights and cross-channel optimization.
-
Webinar
The Power and Psychology of Color
Overdrive’s recorded webinar explores how you can leverage the power of color to influence behavior and shape perceptions around your brand or company.
-
Video
Demand Gen Dashboard Demo
mQuantify gives you the ability to keep a close eye on your marketing investments and ROI with data integration, detailed dashboards, executive summaries, and a 24/7 ability to access and view your results data quickly and easily.
-
Video
mQuantify Product Demo
mQuantify reveals all your important data across the entire sales funnel in real time so you can enable cross-channel optimization to get the most efficient return on ad spend and marketing investments.
-
Guide
The Native Advertising Guide
Get the The Importance of Developing Conversion-Based Personas whitepaper to arm yourself with strategies to generate high-quality leads.
-
Video
Creative Sizzle Reel
Watch our sizzle reel and see case studies that drive measurable actions and higher ROI.
-
Video
The Power of "And Then What?"
Learn how this one simple question drives digital marketers to think beyond the form completion and to follow the customer journey from impression to sale and beyond.
-
Guide
Demand Gen RFP Template for Tech / B2B
This RFP will help you create a comprehensive agency RFP and filter out the firms not ready to rise to your expectations.
-
Video
ABM Customer Journey
Overdrive CEO, Harry J. Gold maps and visualizes a complete ABM customer journey from banner ads, through nurture, all the way to close.
-
Guide
Social Media Cheat Sheet
Use this Social Media Cheat Sheet to enhance your social media strategy, drive engagements, and generate results
-
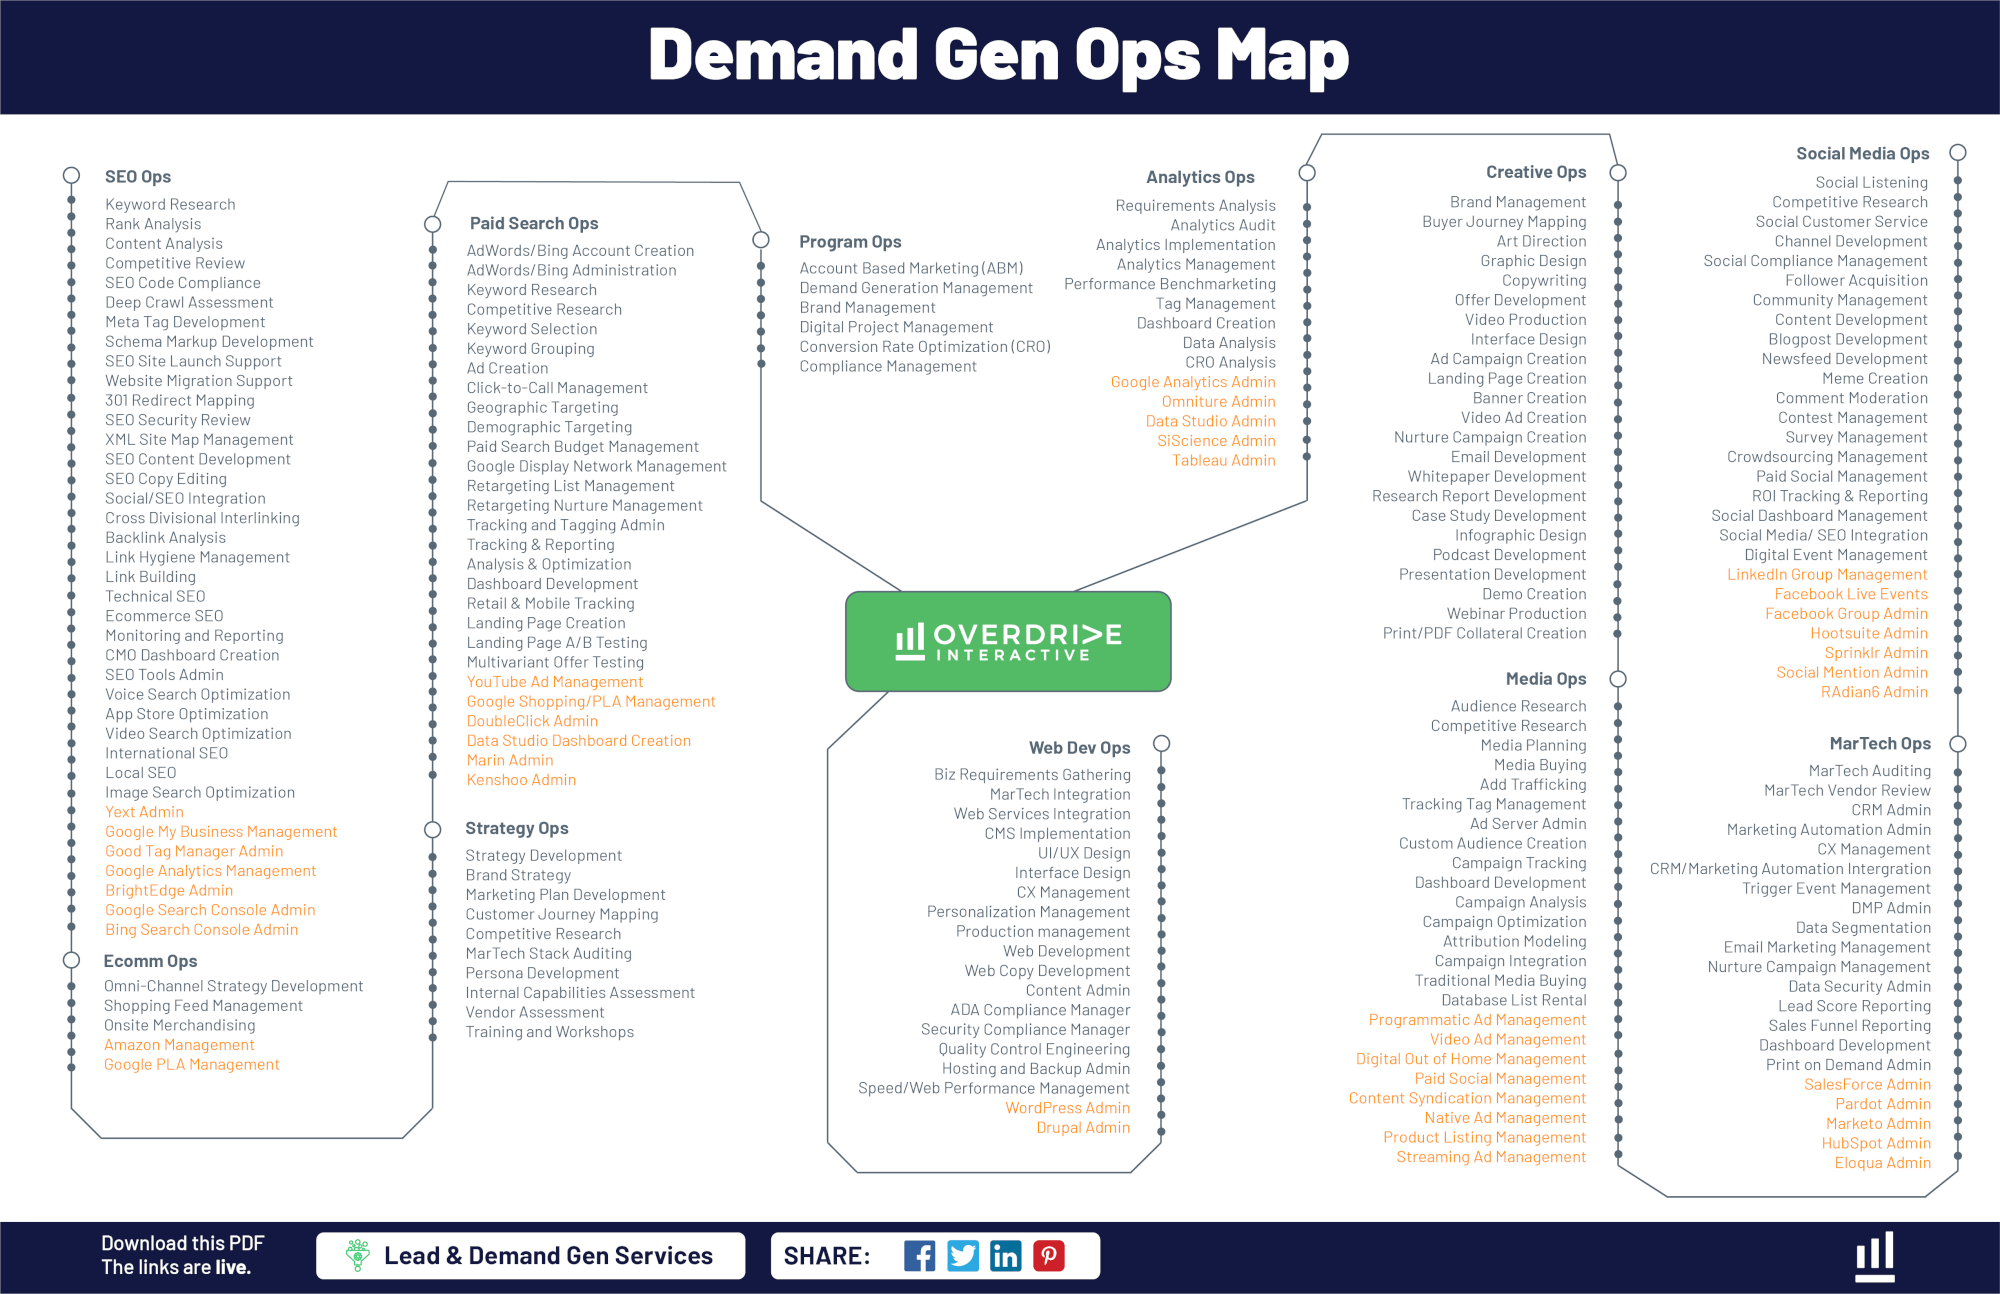
Infographic
Demand Gen Ops. Map
The Demand Gen Ops Map is an infographic of all the skills and tasks you need to succeed in one snapshot with live links to definitions.
-
Webinar
Crafting the Customer Journey
Learn how to craft and deploy powerful customer journeys.
-
Video
Building the Ultimate Digital Marketing Ops. Team
The ultimate enterprise-level digital marketing ops team, along with the essential skills and roles organizations need to thrive in today’s digital-first economy.
-
Infographic
Social Media Map
Explore the evolving social media marketing landscape. Live links to more than 660 sites, apps, and tools broken down into 25 categories.
-
Video
Know your MarTech
Know you MarTech and learn to audit the systems your organization uses to power digital marketing.
-
Webinar
Always-On ABM
Webinar slides and video with tactics you can start using right away.
-
Infographic
Search Marketing Map
Learn to navigate the ever changing landscape of Search Marketing. Live links to over 386 websites, apps, tools, and events, broken into 26 categories.
-
Video
3 Levels of Customer Journey Optimization
Is your customer journey not generating results? Watch Harry J. Gold explain the 3 levels of customer journey optimization.
-
Video
What is the different between ABM and Demand Gen?
Overdrive CEO Harry J. Gold explains the difference between ABM and Demand Gen and how both fit into a full-funnel marketing campaign.
-
Infographic
Conversion Psychology of Color
The Conversion Psychology of Color infographics covers the fundamental facts of color psychology and how to leverage these best practices in your marketing efforts.
-
Video
What are high impact points of optimization?
Lift the performance of all the digital components powering your customer journey. Watch CEO Harry J. Gold visualize all your customer journey components and identify high-impact points of optimization.
-
Video
What are the four questions of marketing management?
Overdrive CEO Harry J. Gold speaks about four questions that you as marketers can ask yourself every day to solve literally 99% of the marketing management issues you are dealing with.
-
Infographic
AI Marketing Map
Learn to navigate the ever-changing landscape of Artificial Intelligence Marketing.
-
Video
Why should you have regular tracking summits?
Overdrive CEO Harry J. Gold discusses the importance of regular tracking summits and how they create transparency and accountability amongst stakeholders across your company.
-
Video
SEM Success for B2B
Learn how you can afford to be at the TOP for all of your terms, maximize conversions while maintaining quality.
-
Video
CRM Data Enrichment
The special sauce to ABM – data and media enrichment. Learn how to execute them in very distinct ways to reach your target audience.
-
Video
Why is a Creative Audit Important for Building Future Campaigns?
Listen as Jessica O'Brien, Creative Director at Overdrive Interactive, explains how to execute a creative audit as well as how often these should be completed.
-
Video
How are Brand Awareness and Demand Gen. Creative Different?
Watch Jessica O'Brien, Creative Director at Overdrive Interactive, explain the difference between Demand Gen and Brand Awareness, as well as how these two strategies can support each other.
-
Video
How Does Creative Help Drive Conversions?
Watch Jessica O'Brien, Creative Director at Overdrive Interactive, explain how creative can convert prospects into customers.
-
Video
6 Customer Journeys in 8 Minutes
Watch CEO Harry J. Gold put together six customer journeys in just eight minutes.
-
Video
How Unified Creative Builds Trust for Brand
Watch Jessica O'Brien, Creative Director at Overdrive Interactive, discuss the benefits of unified creativity.
-
Infographic
Lead Gen Metrics Timeline
The lead generation metrics needed to truly “close the loop,” marking the journey from spend to MROI (media return on investment).
-
Infographic
ABM Roadmap
Critical components of a steady-state ABM program
-
Video
Enterprise SEO Process
Executed for some of the largest eCommerce companies in the world, watch Overdrive CEO Harry J. Gold explain our enterprise level SEO programs.
-
Video
What is Full-Funnel Marketing?
Overdrive CEO Harry J. Gold walks through a full-funnel marketing program and explains the difference between Demand Gen and ABM.
-
Video
What is Intent-Based Targeting?
Do you know what intent-based targeting is and how it plays into your ABM program? Overdrive CEO Harry J. Gold explains this key concept.
-
Video
What is Reverse IP Lookup?
Do you know how reverse IP lookup can benefit your sales efforts? See Overdrive CEO Harry J. Gold explain how this information can create an intent-based sales pipeline for your business development reps.
-
eBook
The Digital Advertising Guide
Get your head around the many advertising options available to digital marketers today.
-
Video
Conversion Oriented Creative
Even the best media plans can’t succeed if your creative doesn’t encourage desired behavior. Watch Overdrive’s approach to conversion oriented creative.
-
Webinar
Ultimate SEO Dashboard for CMOs
Webinar slides and video with tactics CMOs can start using right away.
-
Video
Drive, Capture, Convert, Optimize
Watch CEO Harry J. Gold describe Drive > Capture > Convert > Optimize – a complete digital operations framework.
-
Video
How Digital Marketing Channels Integrate
See Overdrive CEO Harry J. Gold discuss how digital marketing channels integrate and rely on one another for a complete marketing experience.
-
Keynote Speech
5 Digital Pillars of Ecommerce
Drive e-commerce success! Watch the 5 Digital Pillars of Ecommerce.
-
Infographic
Demand Gen Infrastructure
Drive. Capture. Convert. Optimize. Drive traffic, capture leads, nurture prospects, and optimize for an ever increasing ROI.
-
Webinar
Becoming a Marketing Engineer
Webinar slides and video. Learn how to craft the customer journey.
-
Webinar
17 Ways to Integrate SEO & Social
Webinar slides and video with tactics you can start using right away.
-
Guide
14 B2B Social Media Tactics
Guide to weave your content into the social fabric of the web and your industry.
-
Keynote Speech
Quick Start Marketing Automation
Learn how to quickly launch nurture campaigns.
-
Guide
The Native Advertising Guide
Get The Native Advertising Guide and wrap your head around the native ad formats and platforms that will make you a successful digital marketer.
-
Video
Integrated Digital Marketing
How all elements of digital marketing work together in 2 minutes.
-
Video
The Secret to Content Marketing
Learn the Secret to Content Marketing in 2 Minutes.
-
Video
The Social Media Share
This 2-minute video explains the power of the social media share.


 Click here to get the Demand Ops Map