From Data to Decisions: Building the Data Foundation (Pipelines, Warehousing, ETL)
Section 3: Building the Data Foundation (Pipelines, Warehousing, ETL)
In Section 2, we explored how setting clear measurement goals and aligning stakeholders on KPIs creates the blueprint for meaningful analytics. Now we move into the engineering heart of your marketing intelligence engine: building a data foundation that ensures your dashboards are always fueled by accurate, timely, and consistent information.
A modern marketing analytics pipeline isn’t just a convenience — it’s the backbone of your BI system. Without a reliable flow of clean, structured data from all your marketing platforms, even the most beautifully designed dashboard will fail to deliver trust or insight. This section takes you beyond a high-level checklist and into the why and how of constructing a pipeline that works under real-world conditions, scales with your needs, and delivers insights you can actually act on.
1. Data Collection Layer
Your pipeline is only as good as the data feeding it. Modern marketing teams manage a sprawling ecosystem of ad networks, analytics tools, CRM systems, and e‑commerce platforms — each housing valuable slices of the customer story. Unfortunately, these insights are often trapped in silos, making it difficult to get a unified view of performance. The first step is to identify the data sources that truly drive your KPIs and business objectives. Rather than connecting to every possible system, focus on those that yield actionable information, and ensure your access is secure, reliable, and compliant with any privacy regulations.
Common Marketing Data Sources include:
• Advertising: Google Ads, Meta Ads, LinkedIn Ads, Microsoft Ads, TikTok Ads, Amazon Advertising
• Analytics: Google Analytics 4, Adobe Analytics, Mixpanel, Amplitude
• Social Media: Facebook, Instagram, X (Twitter), LinkedIn, YouTube
• Email/CRM: HubSpot, Salesforce, Mailchimp, Klaviyo, Marketo
• E-commerce: Shopify, WooCommerce, Magento, Amazon Seller Central
By mapping each source to specific KPIs — for example, tying Google Ads data directly to ROAS or lead volume goals — you can avoid “data hoarding” that clogs systems and slows analysis.
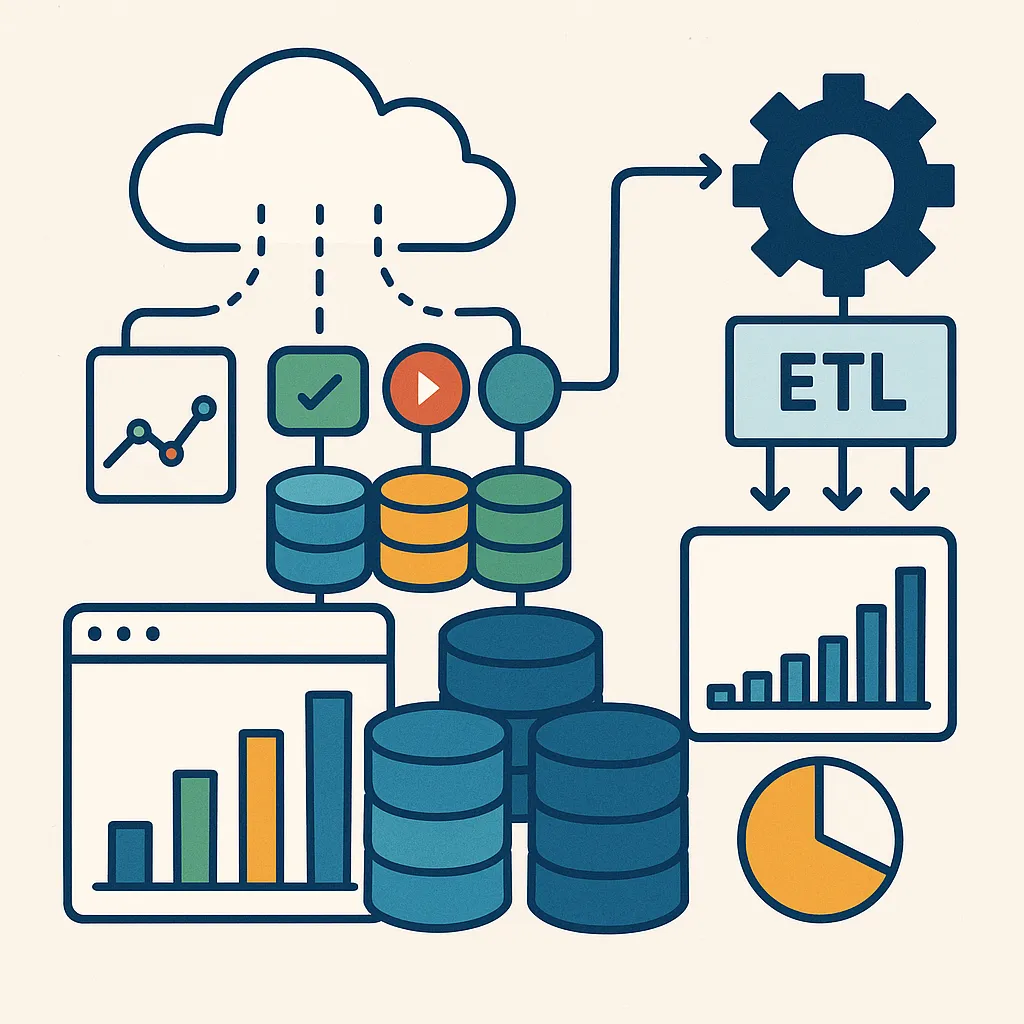
2. Integration Layer
Once you know what you need, the next challenge is making disparate data sources play nicely together. Each platform uses its own data structures, naming conventions, and refresh cycles. Without integration, you’re stuck with manual exports and endless spreadsheet work. ETL (Extract, Transform, Load) or ELT (Extract, Load, Transform) tools automate this process — pulling in data, standardizing formats, reconciling naming differences, and pushing clean datasets into your storage layer.
Popular ETL/ELT solutions include:
• Cloud-based: Supermetrics, Fivetran, Stitch, Airbyte, Zapier
• Enterprise: Talend, Informatica, Microsoft SSIS
• Code-based: Apache Airflow, dbt, custom Python/R scripts
When evaluating tools, consider how frequently you need data refreshed, whether the pricing model fits your volume, and the complexity of your transformation logic. The right integration layer dramatically reduces time-to-insight and minimizes the risk of reporting on stale or inconsistent data.
3. Storage Layer
Your storage layer — often a cloud data warehouse — acts as the central repository for all your cleaned and standardized marketing data. This is where the magic of cross‑platform analysis happens, allowing you to join ad impressions from Meta with conversions tracked in GA4, or email engagement metrics with e‑commerce purchase data.
Common storage options include:
• Cloud Data Warehouses: Google BigQuery, Amazon Redshift, Snowflake, Azure Synapse
• Traditional Databases: Microsoft SQL Server, PostgreSQL, MySQL
• Modern Analytical Platforms: Databricks, ClickHouse, Apache Druid
Your choice will impact not only query speed and scalability but also cost and ease of integration with BI tools. Consider current and projected data volume, your team’s SQL proficiency, and whether you need real-time analytics or can work with scheduled batch updates.
4. Analysis Layer
Analysis is where raw data transforms into strategic intelligence. The depth of your analysis should match your business questions. For some teams, a set of descriptive KPIs in a spreadsheet is enough. For others, advanced statistical modeling and predictive analytics are essential to stay competitive.
Analysis techniques include:
• Basic: Spreadsheets, pivot tables, SQL queries for trend spotting
• Intermediate: Statistical modeling, customer segmentation, cohort analysis
• Advanced: Predictive modeling, attribution modeling, marketing mix modeling (MMM), machine learning
Regardless of complexity, the goal is the same: uncover insights that lead to decisions. A strong analysis layer feeds directly into visualization, enabling you to tell stories backed by data, not guesswork.
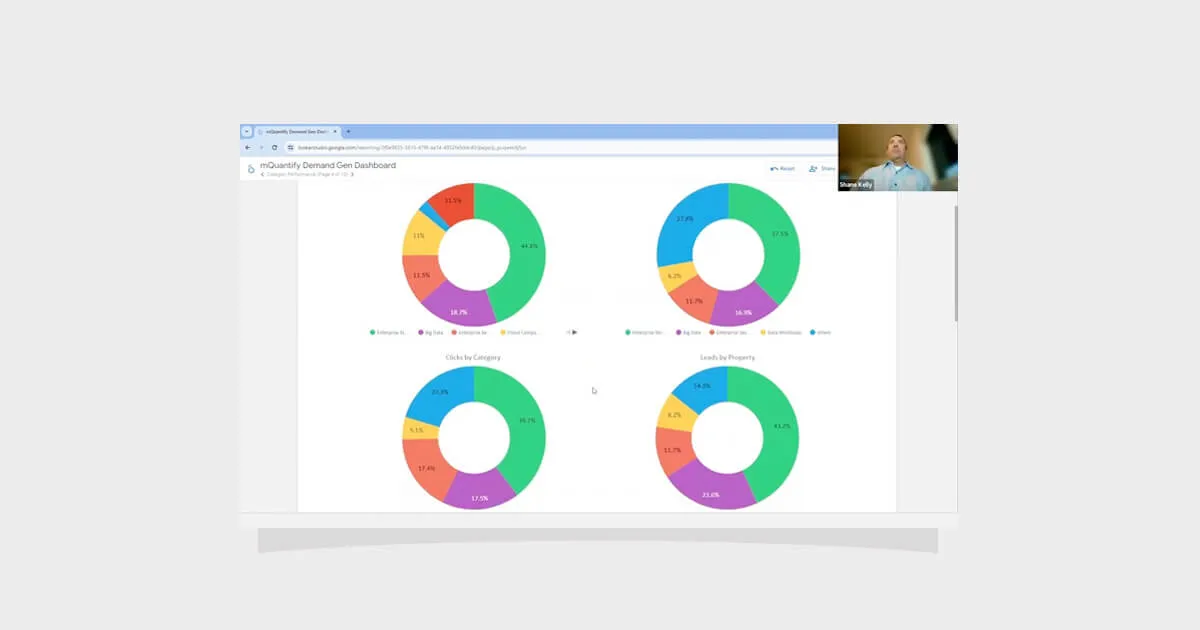
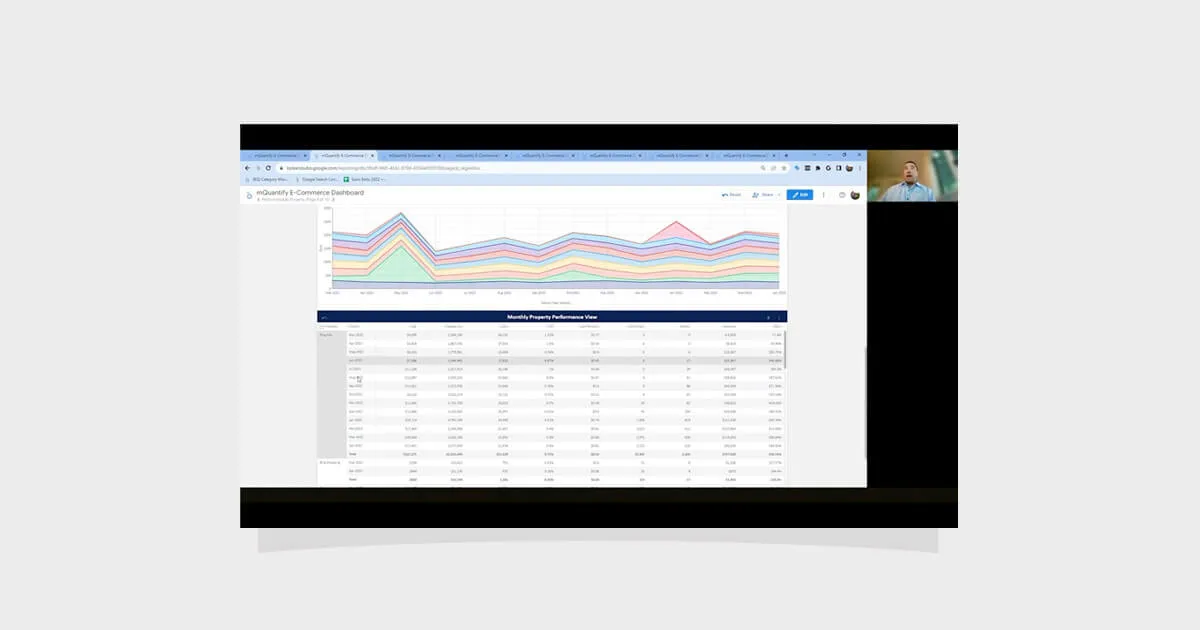
5. Visualization Layer
Although Section 4 of this series dives deeply into visualization, it’s important to remember that the ultimate purpose of your data foundation is to power dashboards, reports, and alerts that drive action. The visualization layer translates your clean, analyzed data into formats your audience can understand — whether it’s an executive glancing at a KPI panel or a marketing manager drilling into channel performance trends.
Matching the right visualization tool to your audience ensures insights are not just available, but usable. Self-service platforms like Looker Studio and Power BI can empower non-technical users, while enterprise-grade tools like Tableau, Looker, and Domo support complex, large-scale reporting needs.
Best Practices for a Resilient Pipeline
• Implement data governance policies to ensure naming conventions, metric definitions, and access permissions are consistent across teams.
• Create detailed documentation of your data models, refresh schedules, and integration logic.
• Monitor pipeline performance regularly to catch bottlenecks or data quality issues early.
• Automate as much as possible to reduce manual errors and free your team for higher-value work.
Benefits of a Strong Data Foundation
A well-engineered data foundation turns marketing analytics from a reactive reporting function into a proactive business driver. By ensuring a single source of truth, you enable cross‑platform insights, faster decision‑making, and scalable operations that can adapt as your marketing mix evolves.
When your pipeline is automated, reliable, and built for growth, you spend less time wrangling spreadsheets and more time interpreting what the data means — and acting on it.
Catch up on the entire From Data to Decisions series.


From Data to Decisions: Building the Data Foundation (Pipelines, Warehousing, ETL)
Download the guide to:
Section 3: Building the Data Foundation (Pipelines, Warehousing, ETL)
In Section 2, we explored how setting clear measurement goals and aligning stakeholders on KPIs creates the blueprint for meaningful analytics. Now we move into the engineering heart of your marketing intelligence engine: building a data foundation that ensures your dashboards are always fueled by accurate, timely, and consistent information.
A modern marketing analytics pipeline isn’t just a convenience — it’s the backbone of your BI system. Without a reliable flow of clean, structured data from all your marketing platforms, even the most beautifully designed dashboard will fail to deliver trust or insight. This section takes you beyond a high-level checklist and into the why and how of constructing a pipeline that works under real-world conditions, scales with your needs, and delivers insights you can actually act on.
1. Data Collection Layer
Your pipeline is only as good as the data feeding it. Modern marketing teams manage a sprawling ecosystem of ad networks, analytics tools, CRM systems, and e‑commerce platforms — each housing valuable slices of the customer story. Unfortunately, these insights are often trapped in silos, making it difficult to get a unified view of performance. The first step is to identify the data sources that truly drive your KPIs and business objectives. Rather than connecting to every possible system, focus on those that yield actionable information, and ensure your access is secure, reliable, and compliant with any privacy regulations.
Common Marketing Data Sources include:
• Advertising: Google Ads, Meta Ads, LinkedIn Ads, Microsoft Ads, TikTok Ads, Amazon Advertising
• Analytics: Google Analytics 4, Adobe Analytics, Mixpanel, Amplitude
• Social Media: Facebook, Instagram, X (Twitter), LinkedIn, YouTube
• Email/CRM: HubSpot, Salesforce, Mailchimp, Klaviyo, Marketo
• E-commerce: Shopify, WooCommerce, Magento, Amazon Seller Central
By mapping each source to specific KPIs — for example, tying Google Ads data directly to ROAS or lead volume goals — you can avoid “data hoarding” that clogs systems and slows analysis.
2. Integration Layer
Once you know what you need, the next challenge is making disparate data sources play nicely together. Each platform uses its own data structures, naming conventions, and refresh cycles. Without integration, you’re stuck with manual exports and endless spreadsheet work. ETL (Extract, Transform, Load) or ELT (Extract, Load, Transform) tools automate this process — pulling in data, standardizing formats, reconciling naming differences, and pushing clean datasets into your storage layer.
Popular ETL/ELT solutions include:
• Cloud-based: Supermetrics, Fivetran, Stitch, Airbyte, Zapier
• Enterprise: Talend, Informatica, Microsoft SSIS
• Code-based: Apache Airflow, dbt, custom Python/R scripts
When evaluating tools, consider how frequently you need data refreshed, whether the pricing model fits your volume, and the complexity of your transformation logic. The right integration layer dramatically reduces time-to-insight and minimizes the risk of reporting on stale or inconsistent data.
3. Storage Layer
Your storage layer — often a cloud data warehouse — acts as the central repository for all your cleaned and standardized marketing data. This is where the magic of cross‑platform analysis happens, allowing you to join ad impressions from Meta with conversions tracked in GA4, or email engagement metrics with e‑commerce purchase data.
Common storage options include:
• Cloud Data Warehouses: Google BigQuery, Amazon Redshift, Snowflake, Azure Synapse
• Traditional Databases: Microsoft SQL Server, PostgreSQL, MySQL
• Modern Analytical Platforms: Databricks, ClickHouse, Apache Druid
Your choice will impact not only query speed and scalability but also cost and ease of integration with BI tools. Consider current and projected data volume, your team’s SQL proficiency, and whether you need real-time analytics or can work with scheduled batch updates.
4. Analysis Layer
Analysis is where raw data transforms into strategic intelligence. The depth of your analysis should match your business questions. For some teams, a set of descriptive KPIs in a spreadsheet is enough. For others, advanced statistical modeling and predictive analytics are essential to stay competitive.
Analysis techniques include:
• Basic: Spreadsheets, pivot tables, SQL queries for trend spotting
• Intermediate: Statistical modeling, customer segmentation, cohort analysis
• Advanced: Predictive modeling, attribution modeling, marketing mix modeling (MMM), machine learning
Regardless of complexity, the goal is the same: uncover insights that lead to decisions. A strong analysis layer feeds directly into visualization, enabling you to tell stories backed by data, not guesswork.
5. Visualization Layer
Although Section 4 of this series dives deeply into visualization, it’s important to remember that the ultimate purpose of your data foundation is to power dashboards, reports, and alerts that drive action. The visualization layer translates your clean, analyzed data into formats your audience can understand — whether it’s an executive glancing at a KPI panel or a marketing manager drilling into channel performance trends.
Matching the right visualization tool to your audience ensures insights are not just available, but usable. Self-service platforms like Looker Studio and Power BI can empower non-technical users, while enterprise-grade tools like Tableau, Looker, and Domo support complex, large-scale reporting needs.
Best Practices for a Resilient Pipeline
• Implement data governance policies to ensure naming conventions, metric definitions, and access permissions are consistent across teams.
• Create detailed documentation of your data models, refresh schedules, and integration logic.
• Monitor pipeline performance regularly to catch bottlenecks or data quality issues early.
• Automate as much as possible to reduce manual errors and free your team for higher-value work.
Benefits of a Strong Data Foundation
A well-engineered data foundation turns marketing analytics from a reactive reporting function into a proactive business driver. By ensuring a single source of truth, you enable cross‑platform insights, faster decision‑making, and scalable operations that can adapt as your marketing mix evolves.
When your pipeline is automated, reliable, and built for growth, you spend less time wrangling spreadsheets and more time interpreting what the data means — and acting on it.
Catch up on the entire From Data to Decisions series.
From Data to Decisions: Building the Data Foundation (Pipelines, Warehousing, ETL)
Key Insights From Our Research
Section 3: Building the Data Foundation (Pipelines, Warehousing, ETL)
In Section 2, we explored how setting clear measurement goals and aligning stakeholders on KPIs creates the blueprint for meaningful analytics. Now we move into the engineering heart of your marketing intelligence engine: building a data foundation that ensures your dashboards are always fueled by accurate, timely, and consistent information.
A modern marketing analytics pipeline isn’t just a convenience — it’s the backbone of your BI system. Without a reliable flow of clean, structured data from all your marketing platforms, even the most beautifully designed dashboard will fail to deliver trust or insight. This section takes you beyond a high-level checklist and into the why and how of constructing a pipeline that works under real-world conditions, scales with your needs, and delivers insights you can actually act on.
1. Data Collection Layer
Your pipeline is only as good as the data feeding it. Modern marketing teams manage a sprawling ecosystem of ad networks, analytics tools, CRM systems, and e‑commerce platforms — each housing valuable slices of the customer story. Unfortunately, these insights are often trapped in silos, making it difficult to get a unified view of performance. The first step is to identify the data sources that truly drive your KPIs and business objectives. Rather than connecting to every possible system, focus on those that yield actionable information, and ensure your access is secure, reliable, and compliant with any privacy regulations.
Common Marketing Data Sources include:
• Advertising: Google Ads, Meta Ads, LinkedIn Ads, Microsoft Ads, TikTok Ads, Amazon Advertising
• Analytics: Google Analytics 4, Adobe Analytics, Mixpanel, Amplitude
• Social Media: Facebook, Instagram, X (Twitter), LinkedIn, YouTube
• Email/CRM: HubSpot, Salesforce, Mailchimp, Klaviyo, Marketo
• E-commerce: Shopify, WooCommerce, Magento, Amazon Seller Central
By mapping each source to specific KPIs — for example, tying Google Ads data directly to ROAS or lead volume goals — you can avoid “data hoarding” that clogs systems and slows analysis.
2. Integration Layer
Once you know what you need, the next challenge is making disparate data sources play nicely together. Each platform uses its own data structures, naming conventions, and refresh cycles. Without integration, you’re stuck with manual exports and endless spreadsheet work. ETL (Extract, Transform, Load) or ELT (Extract, Load, Transform) tools automate this process — pulling in data, standardizing formats, reconciling naming differences, and pushing clean datasets into your storage layer.
Popular ETL/ELT solutions include:
• Cloud-based: Supermetrics, Fivetran, Stitch, Airbyte, Zapier
• Enterprise: Talend, Informatica, Microsoft SSIS
• Code-based: Apache Airflow, dbt, custom Python/R scripts
When evaluating tools, consider how frequently you need data refreshed, whether the pricing model fits your volume, and the complexity of your transformation logic. The right integration layer dramatically reduces time-to-insight and minimizes the risk of reporting on stale or inconsistent data.
3. Storage Layer
Your storage layer — often a cloud data warehouse — acts as the central repository for all your cleaned and standardized marketing data. This is where the magic of cross‑platform analysis happens, allowing you to join ad impressions from Meta with conversions tracked in GA4, or email engagement metrics with e‑commerce purchase data.
Common storage options include:
• Cloud Data Warehouses: Google BigQuery, Amazon Redshift, Snowflake, Azure Synapse
• Traditional Databases: Microsoft SQL Server, PostgreSQL, MySQL
• Modern Analytical Platforms: Databricks, ClickHouse, Apache Druid
Your choice will impact not only query speed and scalability but also cost and ease of integration with BI tools. Consider current and projected data volume, your team’s SQL proficiency, and whether you need real-time analytics or can work with scheduled batch updates.
4. Analysis Layer
Analysis is where raw data transforms into strategic intelligence. The depth of your analysis should match your business questions. For some teams, a set of descriptive KPIs in a spreadsheet is enough. For others, advanced statistical modeling and predictive analytics are essential to stay competitive.
Analysis techniques include:
• Basic: Spreadsheets, pivot tables, SQL queries for trend spotting
• Intermediate: Statistical modeling, customer segmentation, cohort analysis
• Advanced: Predictive modeling, attribution modeling, marketing mix modeling (MMM), machine learning
Regardless of complexity, the goal is the same: uncover insights that lead to decisions. A strong analysis layer feeds directly into visualization, enabling you to tell stories backed by data, not guesswork.
5. Visualization Layer
Although Section 4 of this series dives deeply into visualization, it’s important to remember that the ultimate purpose of your data foundation is to power dashboards, reports, and alerts that drive action. The visualization layer translates your clean, analyzed data into formats your audience can understand — whether it’s an executive glancing at a KPI panel or a marketing manager drilling into channel performance trends.
Matching the right visualization tool to your audience ensures insights are not just available, but usable. Self-service platforms like Looker Studio and Power BI can empower non-technical users, while enterprise-grade tools like Tableau, Looker, and Domo support complex, large-scale reporting needs.
Best Practices for a Resilient Pipeline
• Implement data governance policies to ensure naming conventions, metric definitions, and access permissions are consistent across teams.
• Create detailed documentation of your data models, refresh schedules, and integration logic.
• Monitor pipeline performance regularly to catch bottlenecks or data quality issues early.
• Automate as much as possible to reduce manual errors and free your team for higher-value work.
Benefits of a Strong Data Foundation
A well-engineered data foundation turns marketing analytics from a reactive reporting function into a proactive business driver. By ensuring a single source of truth, you enable cross‑platform insights, faster decision‑making, and scalable operations that can adapt as your marketing mix evolves.
When your pipeline is automated, reliable, and built for growth, you spend less time wrangling spreadsheets and more time interpreting what the data means — and acting on it.
Catch up on the entire From Data to Decisions series.
From Data to Decisions: Building the Data Foundation (Pipelines, Warehousing, ETL)
Get the Complete Whitepaper
From Data to Decisions: Building the Data Foundation (Pipelines, Warehousing, ETL)
Section 3: Building the Data Foundation (Pipelines, Warehousing, ETL)
In Section 2, we explored how setting clear measurement goals and aligning stakeholders on KPIs creates the blueprint for meaningful analytics. Now we move into the engineering heart of your marketing intelligence engine: building a data foundation that ensures your dashboards are always fueled by accurate, timely, and consistent information.
A modern marketing analytics pipeline isn’t just a convenience — it’s the backbone of your BI system. Without a reliable flow of clean, structured data from all your marketing platforms, even the most beautifully designed dashboard will fail to deliver trust or insight. This section takes you beyond a high-level checklist and into the why and how of constructing a pipeline that works under real-world conditions, scales with your needs, and delivers insights you can actually act on.
1. Data Collection Layer
Your pipeline is only as good as the data feeding it. Modern marketing teams manage a sprawling ecosystem of ad networks, analytics tools, CRM systems, and e‑commerce platforms — each housing valuable slices of the customer story. Unfortunately, these insights are often trapped in silos, making it difficult to get a unified view of performance. The first step is to identify the data sources that truly drive your KPIs and business objectives. Rather than connecting to every possible system, focus on those that yield actionable information, and ensure your access is secure, reliable, and compliant with any privacy regulations.
Common Marketing Data Sources include:
• Advertising: Google Ads, Meta Ads, LinkedIn Ads, Microsoft Ads, TikTok Ads, Amazon Advertising
• Analytics: Google Analytics 4, Adobe Analytics, Mixpanel, Amplitude
• Social Media: Facebook, Instagram, X (Twitter), LinkedIn, YouTube
• Email/CRM: HubSpot, Salesforce, Mailchimp, Klaviyo, Marketo
• E-commerce: Shopify, WooCommerce, Magento, Amazon Seller Central
By mapping each source to specific KPIs — for example, tying Google Ads data directly to ROAS or lead volume goals — you can avoid “data hoarding” that clogs systems and slows analysis.
2. Integration Layer
Once you know what you need, the next challenge is making disparate data sources play nicely together. Each platform uses its own data structures, naming conventions, and refresh cycles. Without integration, you’re stuck with manual exports and endless spreadsheet work. ETL (Extract, Transform, Load) or ELT (Extract, Load, Transform) tools automate this process — pulling in data, standardizing formats, reconciling naming differences, and pushing clean datasets into your storage layer.
Popular ETL/ELT solutions include:
• Cloud-based: Supermetrics, Fivetran, Stitch, Airbyte, Zapier
• Enterprise: Talend, Informatica, Microsoft SSIS
• Code-based: Apache Airflow, dbt, custom Python/R scripts
When evaluating tools, consider how frequently you need data refreshed, whether the pricing model fits your volume, and the complexity of your transformation logic. The right integration layer dramatically reduces time-to-insight and minimizes the risk of reporting on stale or inconsistent data.
3. Storage Layer
Your storage layer — often a cloud data warehouse — acts as the central repository for all your cleaned and standardized marketing data. This is where the magic of cross‑platform analysis happens, allowing you to join ad impressions from Meta with conversions tracked in GA4, or email engagement metrics with e‑commerce purchase data.
Common storage options include:
• Cloud Data Warehouses: Google BigQuery, Amazon Redshift, Snowflake, Azure Synapse
• Traditional Databases: Microsoft SQL Server, PostgreSQL, MySQL
• Modern Analytical Platforms: Databricks, ClickHouse, Apache Druid
Your choice will impact not only query speed and scalability but also cost and ease of integration with BI tools. Consider current and projected data volume, your team’s SQL proficiency, and whether you need real-time analytics or can work with scheduled batch updates.
4. Analysis Layer
Analysis is where raw data transforms into strategic intelligence. The depth of your analysis should match your business questions. For some teams, a set of descriptive KPIs in a spreadsheet is enough. For others, advanced statistical modeling and predictive analytics are essential to stay competitive.
Analysis techniques include:
• Basic: Spreadsheets, pivot tables, SQL queries for trend spotting
• Intermediate: Statistical modeling, customer segmentation, cohort analysis
• Advanced: Predictive modeling, attribution modeling, marketing mix modeling (MMM), machine learning
Regardless of complexity, the goal is the same: uncover insights that lead to decisions. A strong analysis layer feeds directly into visualization, enabling you to tell stories backed by data, not guesswork.
5. Visualization Layer
Although Section 4 of this series dives deeply into visualization, it’s important to remember that the ultimate purpose of your data foundation is to power dashboards, reports, and alerts that drive action. The visualization layer translates your clean, analyzed data into formats your audience can understand — whether it’s an executive glancing at a KPI panel or a marketing manager drilling into channel performance trends.
Matching the right visualization tool to your audience ensures insights are not just available, but usable. Self-service platforms like Looker Studio and Power BI can empower non-technical users, while enterprise-grade tools like Tableau, Looker, and Domo support complex, large-scale reporting needs.
Best Practices for a Resilient Pipeline
• Implement data governance policies to ensure naming conventions, metric definitions, and access permissions are consistent across teams.
• Create detailed documentation of your data models, refresh schedules, and integration logic.
• Monitor pipeline performance regularly to catch bottlenecks or data quality issues early.
• Automate as much as possible to reduce manual errors and free your team for higher-value work.
Benefits of a Strong Data Foundation
A well-engineered data foundation turns marketing analytics from a reactive reporting function into a proactive business driver. By ensuring a single source of truth, you enable cross‑platform insights, faster decision‑making, and scalable operations that can adapt as your marketing mix evolves.
When your pipeline is automated, reliable, and built for growth, you spend less time wrangling spreadsheets and more time interpreting what the data means — and acting on it.
Catch up on the entire From Data to Decisions series.
From Data to Decisions: Building the Data Foundation (Pipelines, Warehousing, ETL)
Get the Slides


From Data to Decisions: Building the Data Foundation (Pipelines, Warehousing, ETL)
Section 3: Building the Data Foundation (Pipelines, Warehousing, ETL)
In Section 2, we explored how setting clear measurement goals and aligning stakeholders on KPIs creates the blueprint for meaningful analytics. Now we move into the engineering heart of your marketing intelligence engine: building a data foundation that ensures your dashboards are always fueled by accurate, timely, and consistent information.
A modern marketing analytics pipeline isn’t just a convenience — it’s the backbone of your BI system. Without a reliable flow of clean, structured data from all your marketing platforms, even the most beautifully designed dashboard will fail to deliver trust or insight. This section takes you beyond a high-level checklist and into the why and how of constructing a pipeline that works under real-world conditions, scales with your needs, and delivers insights you can actually act on.
1. Data Collection Layer
Your pipeline is only as good as the data feeding it. Modern marketing teams manage a sprawling ecosystem of ad networks, analytics tools, CRM systems, and e‑commerce platforms — each housing valuable slices of the customer story. Unfortunately, these insights are often trapped in silos, making it difficult to get a unified view of performance. The first step is to identify the data sources that truly drive your KPIs and business objectives. Rather than connecting to every possible system, focus on those that yield actionable information, and ensure your access is secure, reliable, and compliant with any privacy regulations.
Common Marketing Data Sources include:
• Advertising: Google Ads, Meta Ads, LinkedIn Ads, Microsoft Ads, TikTok Ads, Amazon Advertising
• Analytics: Google Analytics 4, Adobe Analytics, Mixpanel, Amplitude
• Social Media: Facebook, Instagram, X (Twitter), LinkedIn, YouTube
• Email/CRM: HubSpot, Salesforce, Mailchimp, Klaviyo, Marketo
• E-commerce: Shopify, WooCommerce, Magento, Amazon Seller Central
By mapping each source to specific KPIs — for example, tying Google Ads data directly to ROAS or lead volume goals — you can avoid “data hoarding” that clogs systems and slows analysis.
2. Integration Layer
Once you know what you need, the next challenge is making disparate data sources play nicely together. Each platform uses its own data structures, naming conventions, and refresh cycles. Without integration, you’re stuck with manual exports and endless spreadsheet work. ETL (Extract, Transform, Load) or ELT (Extract, Load, Transform) tools automate this process — pulling in data, standardizing formats, reconciling naming differences, and pushing clean datasets into your storage layer.
Popular ETL/ELT solutions include:
• Cloud-based: Supermetrics, Fivetran, Stitch, Airbyte, Zapier
• Enterprise: Talend, Informatica, Microsoft SSIS
• Code-based: Apache Airflow, dbt, custom Python/R scripts
When evaluating tools, consider how frequently you need data refreshed, whether the pricing model fits your volume, and the complexity of your transformation logic. The right integration layer dramatically reduces time-to-insight and minimizes the risk of reporting on stale or inconsistent data.
3. Storage Layer
Your storage layer — often a cloud data warehouse — acts as the central repository for all your cleaned and standardized marketing data. This is where the magic of cross‑platform analysis happens, allowing you to join ad impressions from Meta with conversions tracked in GA4, or email engagement metrics with e‑commerce purchase data.
Common storage options include:
• Cloud Data Warehouses: Google BigQuery, Amazon Redshift, Snowflake, Azure Synapse
• Traditional Databases: Microsoft SQL Server, PostgreSQL, MySQL
• Modern Analytical Platforms: Databricks, ClickHouse, Apache Druid
Your choice will impact not only query speed and scalability but also cost and ease of integration with BI tools. Consider current and projected data volume, your team’s SQL proficiency, and whether you need real-time analytics or can work with scheduled batch updates.
4. Analysis Layer
Analysis is where raw data transforms into strategic intelligence. The depth of your analysis should match your business questions. For some teams, a set of descriptive KPIs in a spreadsheet is enough. For others, advanced statistical modeling and predictive analytics are essential to stay competitive.
Analysis techniques include:
• Basic: Spreadsheets, pivot tables, SQL queries for trend spotting
• Intermediate: Statistical modeling, customer segmentation, cohort analysis
• Advanced: Predictive modeling, attribution modeling, marketing mix modeling (MMM), machine learning
Regardless of complexity, the goal is the same: uncover insights that lead to decisions. A strong analysis layer feeds directly into visualization, enabling you to tell stories backed by data, not guesswork.
5. Visualization Layer
Although Section 4 of this series dives deeply into visualization, it’s important to remember that the ultimate purpose of your data foundation is to power dashboards, reports, and alerts that drive action. The visualization layer translates your clean, analyzed data into formats your audience can understand — whether it’s an executive glancing at a KPI panel or a marketing manager drilling into channel performance trends.
Matching the right visualization tool to your audience ensures insights are not just available, but usable. Self-service platforms like Looker Studio and Power BI can empower non-technical users, while enterprise-grade tools like Tableau, Looker, and Domo support complex, large-scale reporting needs.
Best Practices for a Resilient Pipeline
• Implement data governance policies to ensure naming conventions, metric definitions, and access permissions are consistent across teams.
• Create detailed documentation of your data models, refresh schedules, and integration logic.
• Monitor pipeline performance regularly to catch bottlenecks or data quality issues early.
• Automate as much as possible to reduce manual errors and free your team for higher-value work.
Benefits of a Strong Data Foundation
A well-engineered data foundation turns marketing analytics from a reactive reporting function into a proactive business driver. By ensuring a single source of truth, you enable cross‑platform insights, faster decision‑making, and scalable operations that can adapt as your marketing mix evolves.
When your pipeline is automated, reliable, and built for growth, you spend less time wrangling spreadsheets and more time interpreting what the data means — and acting on it.
Catch up on the entire From Data to Decisions series.


From Data to Decisions: Building the Data Foundation (Pipelines, Warehousing, ETL)