From Data to Decisions: Designing Dashboards That Drive Adoption and Clarity

In Section 4, we explored how the right visualizations can transform raw data into compelling narratives. Now, in Section 5, we focus on designing dashboards that not only present these visuals effectively but also drive adoption, usability, and long-term engagement across your organization. The most beautiful charts in the world won’t have an impact if your audience doesn’t use them—or if they can’t quickly find the answers they need. This section covers how to combine visualization best practices with thoughtful dashboard design to create tools that are clear, actionable, and embraced by stakeholders.
The Role of Dashboards in Your BI Engine
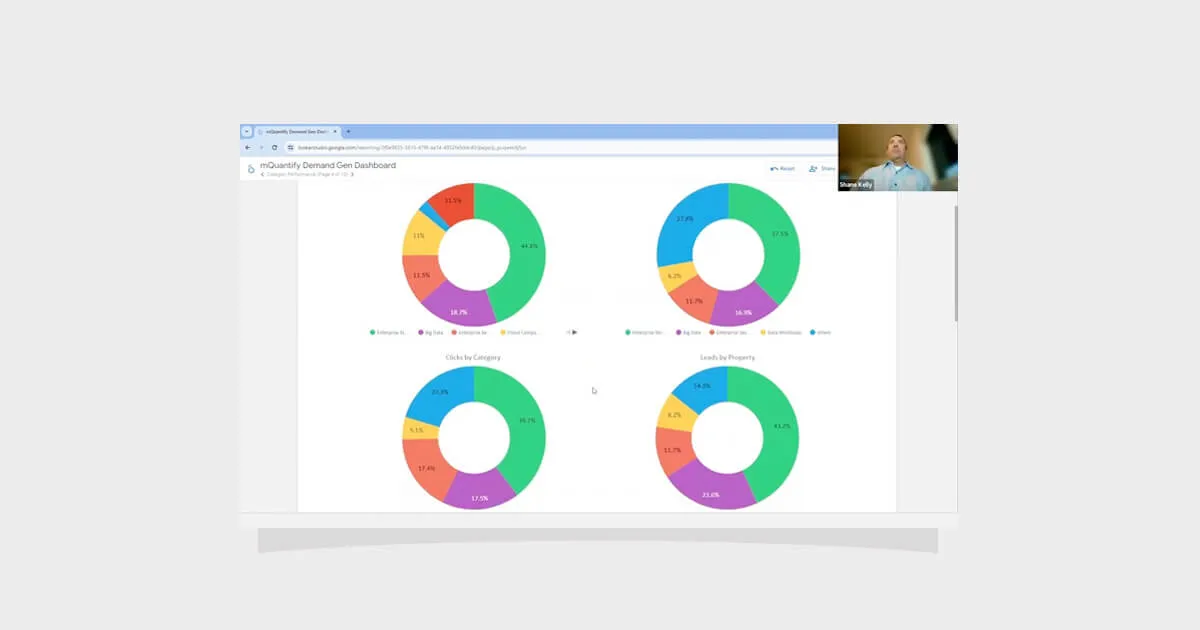
Dashboards are the front door to your marketing analytics engine. They consolidate KPIs, trends, and insights into a single, interactive space where stakeholders can monitor performance, diagnose issues, and make informed decisions. A successful dashboard is more than a static report—it’s an operational command center that adapts to users’ needs, supports strategic conversations, and builds trust in your data.
Key Elements of High-Adoption Dashboards
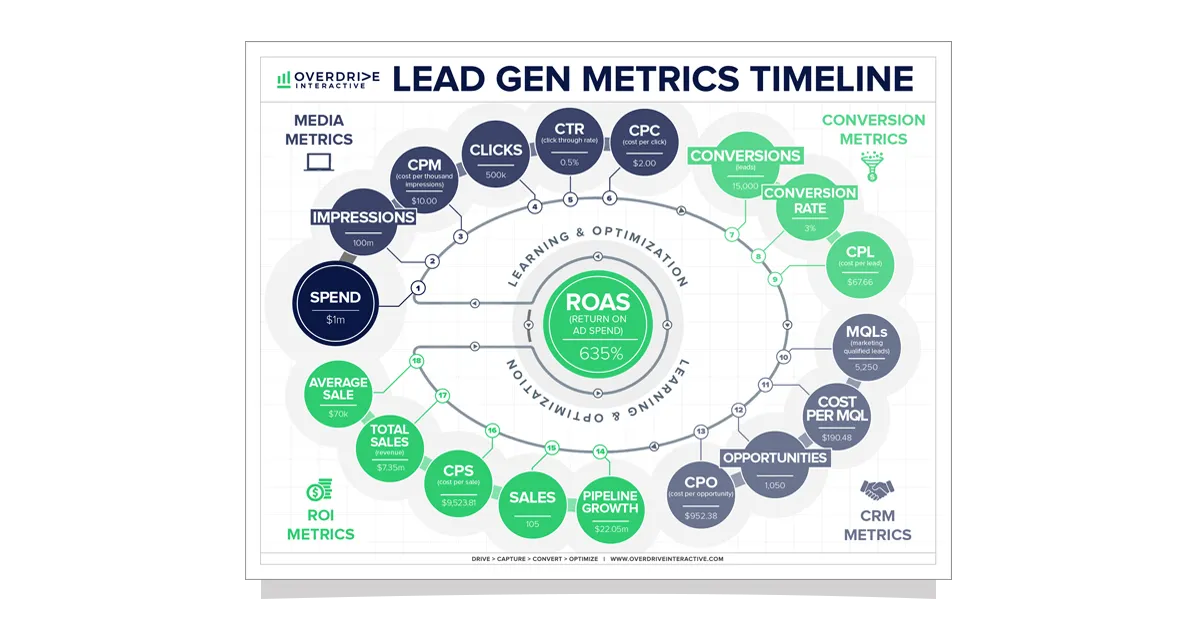
- KPI Performance Panels — Placing a set of core KPIs at the top of the dashboard ensures that executives and managers can immediately assess campaign health. These panels should be configured for relevant timeframes (weekly, monthly, quarterly) and allow for period-over-period comparisons. For example, a marketing dashboard might show spend, clicks, CTR, CPC, and conversions, alongside variance indicators that flag changes requiring attention.
- Comparative Visuals — Bar charts are highly effective for ranking top and bottom performers across campaigns, channels, or regions. By surfacing both successes and underperformers, you enable quick resource reallocation. Highlighting outliers—such as a city generating unusually low leads—prompts deeper investigation.
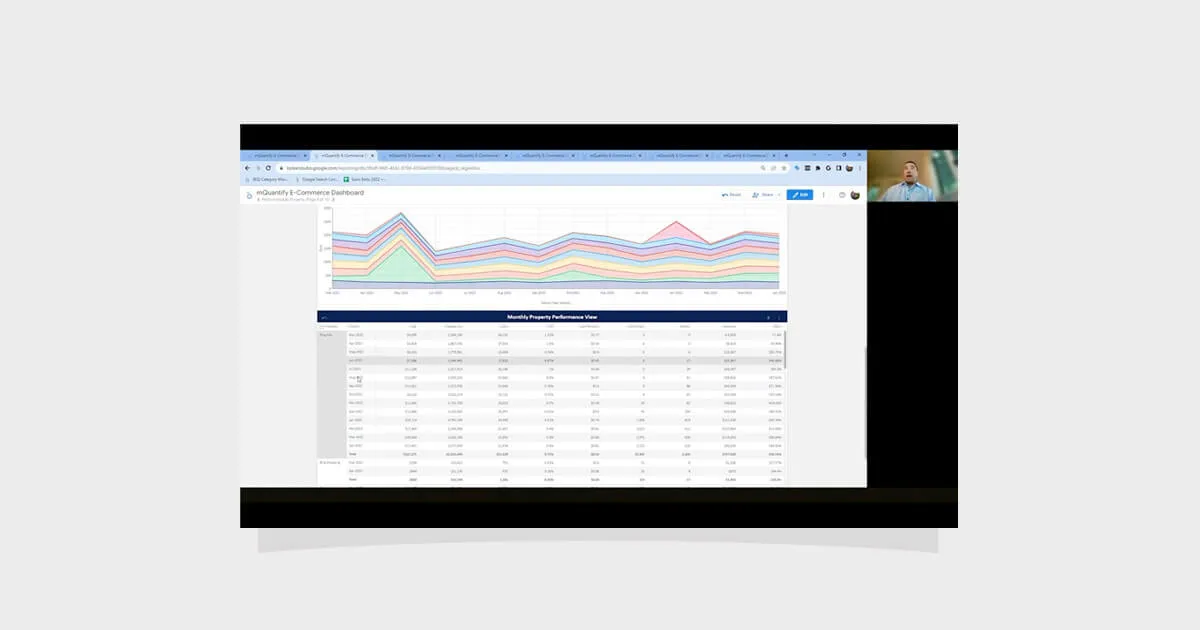
- Trend Analysis — Line graphs provide temporal context, showing whether a metric is improving, declining, or holding steady. These visuals are particularly valuable for monitoring cost efficiency (CPC, CPL) or engagement rates, helping marketers spot anomalies early.
- Summary Tables — Pivot tables or similar summary views allow users to explore multi-level data, such as spend and performance by channel, campaign, and market—all in one compact view. This gives analysts a powerful exploration tool without overloading the dashboard with multiple charts.
- Relationship Analysis — Scatter plots reveal correlations between metrics like spend and ROAS, highlighting which campaigns deliver the greatest efficiency. Outliers become obvious, guiding smarter budget optimization decisions.
Best Practices for Designing Dashboards That Stick
- Know Your Audience — Tailor depth, detail, and terminology to the people who will use the dashboard. Executives need high-level summaries; analysts need granular detail. Engage stakeholders early to ensure alignment.
- Choose the Right Chart for the Job — Match chart type to the question being answered. Avoid unnecessary complexity or decorative visuals that distort interpretation.
- Simplify and Declutter — Use whitespace strategically, remove nonessential labels, and focus attention on what matters most.
- Use Color with Purpose — Stick to a consistent palette, using contrast to draw attention to key metrics or changes. Ensure accessibility for colorblind viewers.
- Label Clearly and Provide Context — Include clear axis labels, legends, and titles. Supplement numbers with benchmarks or narrative annotations to explain trends or anomalies.
- Design for All Screens — Ensure your dashboard is usable on desktop, tablet, and mobile devices so insights are accessible anywhere.
- Test and Iterate — Share early versions with real users, gather feedback, and refine. Adoption grows when users feel heard and see their needs reflected.
Choosing the Right Dashboard Platform
The best dashboard tool depends on your data complexity, refresh needs, and audience. Common options include:
- Google Looker Studio — Free, integrates easily with Google products, great for small teams.
- Tableau — Highly interactive and scalable, suited for enterprise analytics.
- Power BI — Strong Microsoft ecosystem integration.
- Looker — Ideal for embedded analytics in SaaS products.
- Custom Builds (D3.js, R Shiny, Python Dash) — Maximum flexibility for data science and interactivity.
Final Thoughts
An effective dashboard bridges the gap between analysis and action. When designed with clarity, relevance, and user experience in mind, it becomes the go-to resource for performance insights—fostering a data-driven culture across your team.
The next section will focus on interpreting and acting on the patterns your dashboard reveals, turning insight into measurable business impact.


From Data to Decisions: Designing Dashboards That Drive Adoption and Clarity
Download the guide to:
In Section 4, we explored how the right visualizations can transform raw data into compelling narratives. Now, in Section 5, we focus on designing dashboards that not only present these visuals effectively but also drive adoption, usability, and long-term engagement across your organization. The most beautiful charts in the world won’t have an impact if your audience doesn’t use them—or if they can’t quickly find the answers they need. This section covers how to combine visualization best practices with thoughtful dashboard design to create tools that are clear, actionable, and embraced by stakeholders.
The Role of Dashboards in Your BI Engine
Dashboards are the front door to your marketing analytics engine. They consolidate KPIs, trends, and insights into a single, interactive space where stakeholders can monitor performance, diagnose issues, and make informed decisions. A successful dashboard is more than a static report—it’s an operational command center that adapts to users’ needs, supports strategic conversations, and builds trust in your data.
Key Elements of High-Adoption Dashboards
- KPI Performance Panels — Placing a set of core KPIs at the top of the dashboard ensures that executives and managers can immediately assess campaign health. These panels should be configured for relevant timeframes (weekly, monthly, quarterly) and allow for period-over-period comparisons. For example, a marketing dashboard might show spend, clicks, CTR, CPC, and conversions, alongside variance indicators that flag changes requiring attention.
- Comparative Visuals — Bar charts are highly effective for ranking top and bottom performers across campaigns, channels, or regions. By surfacing both successes and underperformers, you enable quick resource reallocation. Highlighting outliers—such as a city generating unusually low leads—prompts deeper investigation.
- Trend Analysis — Line graphs provide temporal context, showing whether a metric is improving, declining, or holding steady. These visuals are particularly valuable for monitoring cost efficiency (CPC, CPL) or engagement rates, helping marketers spot anomalies early.
- Summary Tables — Pivot tables or similar summary views allow users to explore multi-level data, such as spend and performance by channel, campaign, and market—all in one compact view. This gives analysts a powerful exploration tool without overloading the dashboard with multiple charts.
- Relationship Analysis — Scatter plots reveal correlations between metrics like spend and ROAS, highlighting which campaigns deliver the greatest efficiency. Outliers become obvious, guiding smarter budget optimization decisions.
Best Practices for Designing Dashboards That Stick
- Know Your Audience — Tailor depth, detail, and terminology to the people who will use the dashboard. Executives need high-level summaries; analysts need granular detail. Engage stakeholders early to ensure alignment.
- Choose the Right Chart for the Job — Match chart type to the question being answered. Avoid unnecessary complexity or decorative visuals that distort interpretation.
- Simplify and Declutter — Use whitespace strategically, remove nonessential labels, and focus attention on what matters most.
- Use Color with Purpose — Stick to a consistent palette, using contrast to draw attention to key metrics or changes. Ensure accessibility for colorblind viewers.
- Label Clearly and Provide Context — Include clear axis labels, legends, and titles. Supplement numbers with benchmarks or narrative annotations to explain trends or anomalies.
- Design for All Screens — Ensure your dashboard is usable on desktop, tablet, and mobile devices so insights are accessible anywhere.
- Test and Iterate — Share early versions with real users, gather feedback, and refine. Adoption grows when users feel heard and see their needs reflected.
Choosing the Right Dashboard Platform
The best dashboard tool depends on your data complexity, refresh needs, and audience. Common options include:
- Google Looker Studio — Free, integrates easily with Google products, great for small teams.
- Tableau — Highly interactive and scalable, suited for enterprise analytics.
- Power BI — Strong Microsoft ecosystem integration.
- Looker — Ideal for embedded analytics in SaaS products.
- Custom Builds (D3.js, R Shiny, Python Dash) — Maximum flexibility for data science and interactivity.
Final Thoughts
An effective dashboard bridges the gap between analysis and action. When designed with clarity, relevance, and user experience in mind, it becomes the go-to resource for performance insights—fostering a data-driven culture across your team.
The next section will focus on interpreting and acting on the patterns your dashboard reveals, turning insight into measurable business impact.
From Data to Decisions: Designing Dashboards That Drive Adoption and Clarity
Key Insights From Our Research
In Section 4, we explored how the right visualizations can transform raw data into compelling narratives. Now, in Section 5, we focus on designing dashboards that not only present these visuals effectively but also drive adoption, usability, and long-term engagement across your organization. The most beautiful charts in the world won’t have an impact if your audience doesn’t use them—or if they can’t quickly find the answers they need. This section covers how to combine visualization best practices with thoughtful dashboard design to create tools that are clear, actionable, and embraced by stakeholders.
The Role of Dashboards in Your BI Engine
Dashboards are the front door to your marketing analytics engine. They consolidate KPIs, trends, and insights into a single, interactive space where stakeholders can monitor performance, diagnose issues, and make informed decisions. A successful dashboard is more than a static report—it’s an operational command center that adapts to users’ needs, supports strategic conversations, and builds trust in your data.
Key Elements of High-Adoption Dashboards
- KPI Performance Panels — Placing a set of core KPIs at the top of the dashboard ensures that executives and managers can immediately assess campaign health. These panels should be configured for relevant timeframes (weekly, monthly, quarterly) and allow for period-over-period comparisons. For example, a marketing dashboard might show spend, clicks, CTR, CPC, and conversions, alongside variance indicators that flag changes requiring attention.
- Comparative Visuals — Bar charts are highly effective for ranking top and bottom performers across campaigns, channels, or regions. By surfacing both successes and underperformers, you enable quick resource reallocation. Highlighting outliers—such as a city generating unusually low leads—prompts deeper investigation.
- Trend Analysis — Line graphs provide temporal context, showing whether a metric is improving, declining, or holding steady. These visuals are particularly valuable for monitoring cost efficiency (CPC, CPL) or engagement rates, helping marketers spot anomalies early.
- Summary Tables — Pivot tables or similar summary views allow users to explore multi-level data, such as spend and performance by channel, campaign, and market—all in one compact view. This gives analysts a powerful exploration tool without overloading the dashboard with multiple charts.
- Relationship Analysis — Scatter plots reveal correlations between metrics like spend and ROAS, highlighting which campaigns deliver the greatest efficiency. Outliers become obvious, guiding smarter budget optimization decisions.
Best Practices for Designing Dashboards That Stick
- Know Your Audience — Tailor depth, detail, and terminology to the people who will use the dashboard. Executives need high-level summaries; analysts need granular detail. Engage stakeholders early to ensure alignment.
- Choose the Right Chart for the Job — Match chart type to the question being answered. Avoid unnecessary complexity or decorative visuals that distort interpretation.
- Simplify and Declutter — Use whitespace strategically, remove nonessential labels, and focus attention on what matters most.
- Use Color with Purpose — Stick to a consistent palette, using contrast to draw attention to key metrics or changes. Ensure accessibility for colorblind viewers.
- Label Clearly and Provide Context — Include clear axis labels, legends, and titles. Supplement numbers with benchmarks or narrative annotations to explain trends or anomalies.
- Design for All Screens — Ensure your dashboard is usable on desktop, tablet, and mobile devices so insights are accessible anywhere.
- Test and Iterate — Share early versions with real users, gather feedback, and refine. Adoption grows when users feel heard and see their needs reflected.
Choosing the Right Dashboard Platform
The best dashboard tool depends on your data complexity, refresh needs, and audience. Common options include:
- Google Looker Studio — Free, integrates easily with Google products, great for small teams.
- Tableau — Highly interactive and scalable, suited for enterprise analytics.
- Power BI — Strong Microsoft ecosystem integration.
- Looker — Ideal for embedded analytics in SaaS products.
- Custom Builds (D3.js, R Shiny, Python Dash) — Maximum flexibility for data science and interactivity.
Final Thoughts
An effective dashboard bridges the gap between analysis and action. When designed with clarity, relevance, and user experience in mind, it becomes the go-to resource for performance insights—fostering a data-driven culture across your team.
The next section will focus on interpreting and acting on the patterns your dashboard reveals, turning insight into measurable business impact.
From Data to Decisions: Designing Dashboards That Drive Adoption and Clarity
Get the Complete Whitepaper
From Data to Decisions: Designing Dashboards That Drive Adoption and Clarity
In Section 4, we explored how the right visualizations can transform raw data into compelling narratives. Now, in Section 5, we focus on designing dashboards that not only present these visuals effectively but also drive adoption, usability, and long-term engagement across your organization. The most beautiful charts in the world won’t have an impact if your audience doesn’t use them—or if they can’t quickly find the answers they need. This section covers how to combine visualization best practices with thoughtful dashboard design to create tools that are clear, actionable, and embraced by stakeholders.
The Role of Dashboards in Your BI Engine
Dashboards are the front door to your marketing analytics engine. They consolidate KPIs, trends, and insights into a single, interactive space where stakeholders can monitor performance, diagnose issues, and make informed decisions. A successful dashboard is more than a static report—it’s an operational command center that adapts to users’ needs, supports strategic conversations, and builds trust in your data.
Key Elements of High-Adoption Dashboards
- KPI Performance Panels — Placing a set of core KPIs at the top of the dashboard ensures that executives and managers can immediately assess campaign health. These panels should be configured for relevant timeframes (weekly, monthly, quarterly) and allow for period-over-period comparisons. For example, a marketing dashboard might show spend, clicks, CTR, CPC, and conversions, alongside variance indicators that flag changes requiring attention.
- Comparative Visuals — Bar charts are highly effective for ranking top and bottom performers across campaigns, channels, or regions. By surfacing both successes and underperformers, you enable quick resource reallocation. Highlighting outliers—such as a city generating unusually low leads—prompts deeper investigation.
- Trend Analysis — Line graphs provide temporal context, showing whether a metric is improving, declining, or holding steady. These visuals are particularly valuable for monitoring cost efficiency (CPC, CPL) or engagement rates, helping marketers spot anomalies early.
- Summary Tables — Pivot tables or similar summary views allow users to explore multi-level data, such as spend and performance by channel, campaign, and market—all in one compact view. This gives analysts a powerful exploration tool without overloading the dashboard with multiple charts.
- Relationship Analysis — Scatter plots reveal correlations between metrics like spend and ROAS, highlighting which campaigns deliver the greatest efficiency. Outliers become obvious, guiding smarter budget optimization decisions.
Best Practices for Designing Dashboards That Stick
- Know Your Audience — Tailor depth, detail, and terminology to the people who will use the dashboard. Executives need high-level summaries; analysts need granular detail. Engage stakeholders early to ensure alignment.
- Choose the Right Chart for the Job — Match chart type to the question being answered. Avoid unnecessary complexity or decorative visuals that distort interpretation.
- Simplify and Declutter — Use whitespace strategically, remove nonessential labels, and focus attention on what matters most.
- Use Color with Purpose — Stick to a consistent palette, using contrast to draw attention to key metrics or changes. Ensure accessibility for colorblind viewers.
- Label Clearly and Provide Context — Include clear axis labels, legends, and titles. Supplement numbers with benchmarks or narrative annotations to explain trends or anomalies.
- Design for All Screens — Ensure your dashboard is usable on desktop, tablet, and mobile devices so insights are accessible anywhere.
- Test and Iterate — Share early versions with real users, gather feedback, and refine. Adoption grows when users feel heard and see their needs reflected.
Choosing the Right Dashboard Platform
The best dashboard tool depends on your data complexity, refresh needs, and audience. Common options include:
- Google Looker Studio — Free, integrates easily with Google products, great for small teams.
- Tableau — Highly interactive and scalable, suited for enterprise analytics.
- Power BI — Strong Microsoft ecosystem integration.
- Looker — Ideal for embedded analytics in SaaS products.
- Custom Builds (D3.js, R Shiny, Python Dash) — Maximum flexibility for data science and interactivity.
Final Thoughts
An effective dashboard bridges the gap between analysis and action. When designed with clarity, relevance, and user experience in mind, it becomes the go-to resource for performance insights—fostering a data-driven culture across your team.
The next section will focus on interpreting and acting on the patterns your dashboard reveals, turning insight into measurable business impact.
From Data to Decisions: Designing Dashboards That Drive Adoption and Clarity
Get the Slides


From Data to Decisions: Designing Dashboards That Drive Adoption and Clarity
In Section 4, we explored how the right visualizations can transform raw data into compelling narratives. Now, in Section 5, we focus on designing dashboards that not only present these visuals effectively but also drive adoption, usability, and long-term engagement across your organization. The most beautiful charts in the world won’t have an impact if your audience doesn’t use them—or if they can’t quickly find the answers they need. This section covers how to combine visualization best practices with thoughtful dashboard design to create tools that are clear, actionable, and embraced by stakeholders.
The Role of Dashboards in Your BI Engine
Dashboards are the front door to your marketing analytics engine. They consolidate KPIs, trends, and insights into a single, interactive space where stakeholders can monitor performance, diagnose issues, and make informed decisions. A successful dashboard is more than a static report—it’s an operational command center that adapts to users’ needs, supports strategic conversations, and builds trust in your data.
Key Elements of High-Adoption Dashboards
- KPI Performance Panels — Placing a set of core KPIs at the top of the dashboard ensures that executives and managers can immediately assess campaign health. These panels should be configured for relevant timeframes (weekly, monthly, quarterly) and allow for period-over-period comparisons. For example, a marketing dashboard might show spend, clicks, CTR, CPC, and conversions, alongside variance indicators that flag changes requiring attention.
- Comparative Visuals — Bar charts are highly effective for ranking top and bottom performers across campaigns, channels, or regions. By surfacing both successes and underperformers, you enable quick resource reallocation. Highlighting outliers—such as a city generating unusually low leads—prompts deeper investigation.
- Trend Analysis — Line graphs provide temporal context, showing whether a metric is improving, declining, or holding steady. These visuals are particularly valuable for monitoring cost efficiency (CPC, CPL) or engagement rates, helping marketers spot anomalies early.
- Summary Tables — Pivot tables or similar summary views allow users to explore multi-level data, such as spend and performance by channel, campaign, and market—all in one compact view. This gives analysts a powerful exploration tool without overloading the dashboard with multiple charts.
- Relationship Analysis — Scatter plots reveal correlations between metrics like spend and ROAS, highlighting which campaigns deliver the greatest efficiency. Outliers become obvious, guiding smarter budget optimization decisions.
Best Practices for Designing Dashboards That Stick
- Know Your Audience — Tailor depth, detail, and terminology to the people who will use the dashboard. Executives need high-level summaries; analysts need granular detail. Engage stakeholders early to ensure alignment.
- Choose the Right Chart for the Job — Match chart type to the question being answered. Avoid unnecessary complexity or decorative visuals that distort interpretation.
- Simplify and Declutter — Use whitespace strategically, remove nonessential labels, and focus attention on what matters most.
- Use Color with Purpose — Stick to a consistent palette, using contrast to draw attention to key metrics or changes. Ensure accessibility for colorblind viewers.
- Label Clearly and Provide Context — Include clear axis labels, legends, and titles. Supplement numbers with benchmarks or narrative annotations to explain trends or anomalies.
- Design for All Screens — Ensure your dashboard is usable on desktop, tablet, and mobile devices so insights are accessible anywhere.
- Test and Iterate — Share early versions with real users, gather feedback, and refine. Adoption grows when users feel heard and see their needs reflected.
Choosing the Right Dashboard Platform
The best dashboard tool depends on your data complexity, refresh needs, and audience. Common options include:
- Google Looker Studio — Free, integrates easily with Google products, great for small teams.
- Tableau — Highly interactive and scalable, suited for enterprise analytics.
- Power BI — Strong Microsoft ecosystem integration.
- Looker — Ideal for embedded analytics in SaaS products.
- Custom Builds (D3.js, R Shiny, Python Dash) — Maximum flexibility for data science and interactivity.
Final Thoughts
An effective dashboard bridges the gap between analysis and action. When designed with clarity, relevance, and user experience in mind, it becomes the go-to resource for performance insights—fostering a data-driven culture across your team.
The next section will focus on interpreting and acting on the patterns your dashboard reveals, turning insight into measurable business impact.
From Data to Decisions: Designing Dashboards That Drive Adoption and Clarity