As a CMO, you will receive daily, weekly, or monthly reports from your marketing teams with many digital marketing KPIs and metrics; however, you need to break through the clutter and understand the six crucial Google Analytics KPIs you need to monitor to ensure online marketing campaigns perform well.
1. Conversions
Using Google Analytics, you can track and report on several conversion metrics based on your goals: Revenue, Asset Downloads, Email Subscribes, Form Fills, Request a Demo, etc. Although you may track conversions in your CRM, setting up goals in Google Analytics allows you to correlate user behavior on your website with conversions.
Tip: Segment your goals by product category, subfolder, or individual page instead of reporting on the total to make your reports more understandable and actionable.
Example KPI (Revenue)
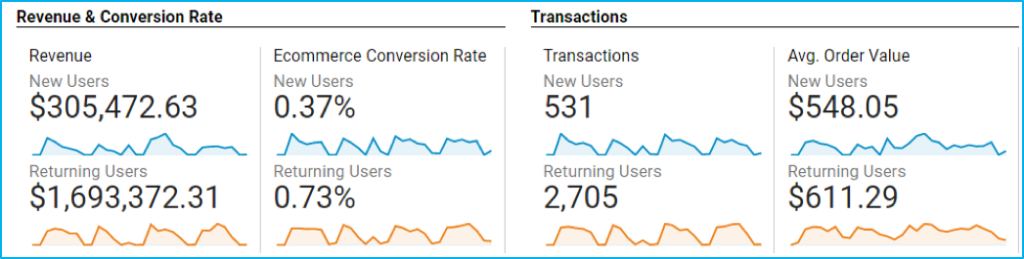
If you have eCommerce tracking, have your team analyze your revenue tracking in Google Analytics and create a relationship between revenue and another KPI (e.g., conversion rate) to understand the whole picture.
You can analyze Product Revenue by Product, SKU, Product Category, and Product Brand in Google Analytics.
If you cannot track revenue in Google Analytics (e.g., B2B SaaS signups), assign a monetary value to your tracked goals.
- How much would you pay for a qualified sales lead to complete a form?
- Download a whitepaper?
- Watch a Webinar?
Another way to measure revenue is to prioritize each goal as a monetary value (on a scale of $1-$3, with $3 the most important goal).
2. Conversion Rate
Record the conversion rate and your industry’s conversion rate at the start of your campaigns to benchmark success. Knowing the conversion rate for each stage of your customer journey allows you to adjust your overall strategy and help your team optimize for conversions more efficiently.
3. Average Order Value
Average Order Value (AOV) = Revenue/ Number of Order
Use the eCommerce section in Google Analytics to find your products’ Average Order Value (AOV) to adjust your paid, organic, social media marketing, or email campaigns.
Tip: Use Google Analytics segments to analyze the Average Order Value (AOV) by New Visitor, Returning Visitor, etc.
4. Media Equivalent Value
Average CPC x Organic Visits
(Via Google Search Console and Google Ads in Google Analytics)
Media Equivalent Value calculates how much more paid search budget you would need if you had not already received organic traffic from strong keyword rankings.
Step #1: Choose the organic traffic date range and record the total.
Step #2: Ask your team to navigate to Acquisition > Google Ads to find your paid search campaigns’ average cost-per-click (CPC) for the same date range.
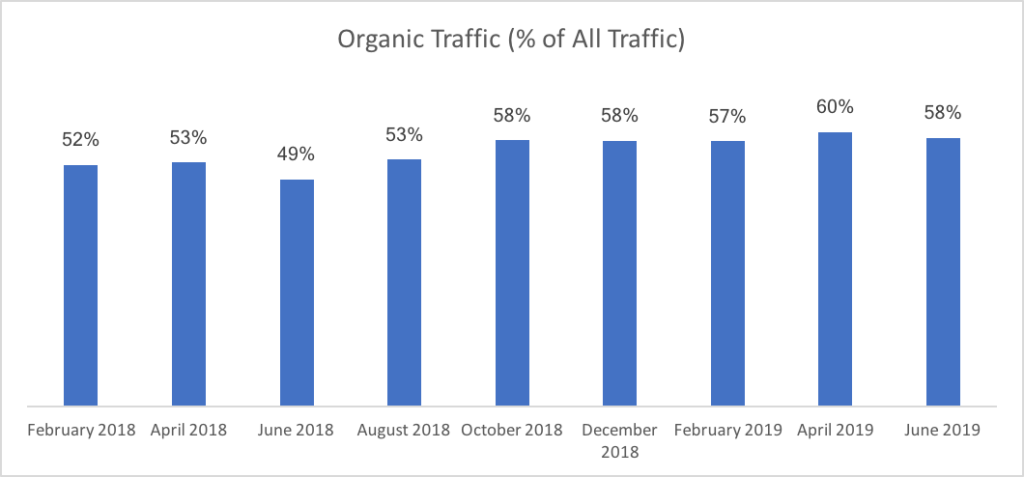
5. Organic Traffic Percentage
Ask for a trendline on how your organic traffic is performing compared to other marketing channels to truly understand the importance of organic search. This insight will also help you find any red flags in your inbound campaigns and lead gen activities and measure brand awareness.
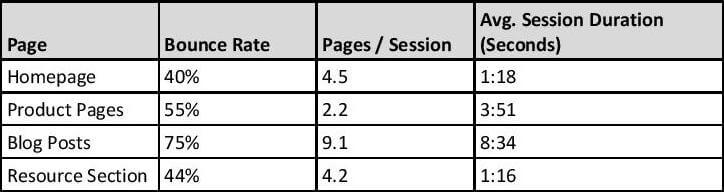
6. Behavioral
Find out if your campaigns need adjustments by analyzing the behavioral metrics— Bounce Rate, Pages per Session, Average Session Duration—of your Homepage, Product/Solutions Pages, Blog Posts, Media Assets, etc.
Download our CMO Dashboard to analyze these six KPIs in one view.